
Overview – Correlation studies
A correlation measures the strength and direction of a relationship between two naturally occurring variables. Unlike experiments, there is no independent variable (IV) being manipulated and no dependent variable (DV) being measured. Instead, the variables researched are called co-variables (co-occurring variables).
In psychology, correlational studies can be categorised into 3 outcomes:
- Positive correlation: As one co-variable increases, the other co-variable also increases.
- Negative correlation: As one co-variable increases, the other co-variable decreases.
- No correlation: There is no relationship between the two co-variables.
To evaluate a relationship, researchers calculate a correlation coefficient – a numerical score ranging from -1 to +1 that quantifies the strength and direction of the link.
Features of correlation studies
These topics are covered in more detail in other pages, but here’s a quick reminder of some of the terms needed to understand correlational studies:
- The co-variables are the two measurable things being investigated in a correlational study to see if there is a relationship between them. Unlike an experiment, neither variable is manipulated or controlled by the researcher, so they are not called independent or dependent variables. Instead, they are called co-variables (co-occurring variables).
- So, if we were investigating whether time spent revising and exam performance are linked, the two co-variables could be:
- Time spent revising (measured in hours)
- and exam performance (measured in percentage scored on the test).
- So, if we were investigating whether time spent revising and exam performance are linked, the two co-variables could be:
- Analysing the data of the two co-variables gives a correlation coefficient – a mathematical score ranging between -1 to +1 that quantifies the strength and direction of the relationship between two co-variables.
- A score of +1 indicates a perfect positive correlation,
- A score of -1 indicates a perfect negative correlation,
- And a score of 0 indicates no relationship at all.
- For example, if we were investigating whether time spent revising and exam performance, a correlation coefficient of +0.8 would represent a strong positive correlation. In other words, it shows that as revision time increases, exam performance increases significantly.
There are many ways to calculate correlation coefficient. For example:
- Chi squared test for nominal data
- Spearman’s rho test for ordinal data
- Pearson’s r for interval data.
Evaluation: Correlation studies
Strengths of correlation studies:
- Complex or unethical variables: Correlations enable researchers to investigate variables that would be too complicated or unethical to manipulate in experiments to see if a relationship exists. For example, setting up an experiment where researchers force pregnant women to smoke cigarettes (IV) in order to measure the impact on baby birth weight (DV) would be completely unethical. However, by measuring these factors naturally as co-variables, researchers can ethically test for a relationship between these two factors without manipulating anyone’s behaviour.
- Easy to collect data: Correlational studies can be relatively straightforward to conduct because secondary data can frequently be used.
Weaknesses of correlation studies:
- Doesn’t establish causation: No matter how strong the relationship, a correlational study can’t prove cause and effect. For example, there is a strong positive correlation between ice cream sales and shark attacks – but eating ice cream doesn’t cause shark attacks, nor do shark attacks make people eat more ice cream. Both co-variables rise in response to a third variable, i.e. warm summer weather. As such, correlations only show that a relationship exists, not what actually causes it.
- Requires further research: Because a correlation only identifies a relationship (see above), further research into other outside variables is always required to identify the actual underlying cause.
Types of correlation
In psychology, correlations can be categorised into 3 outcomes:
- Positive correlation: As one co-variable increases, the other co-variable also increases.
- Negative correlation: As one co-variable increases, the other co-variable decreases.
- No correlation: There is no relationship between the two co-variables.
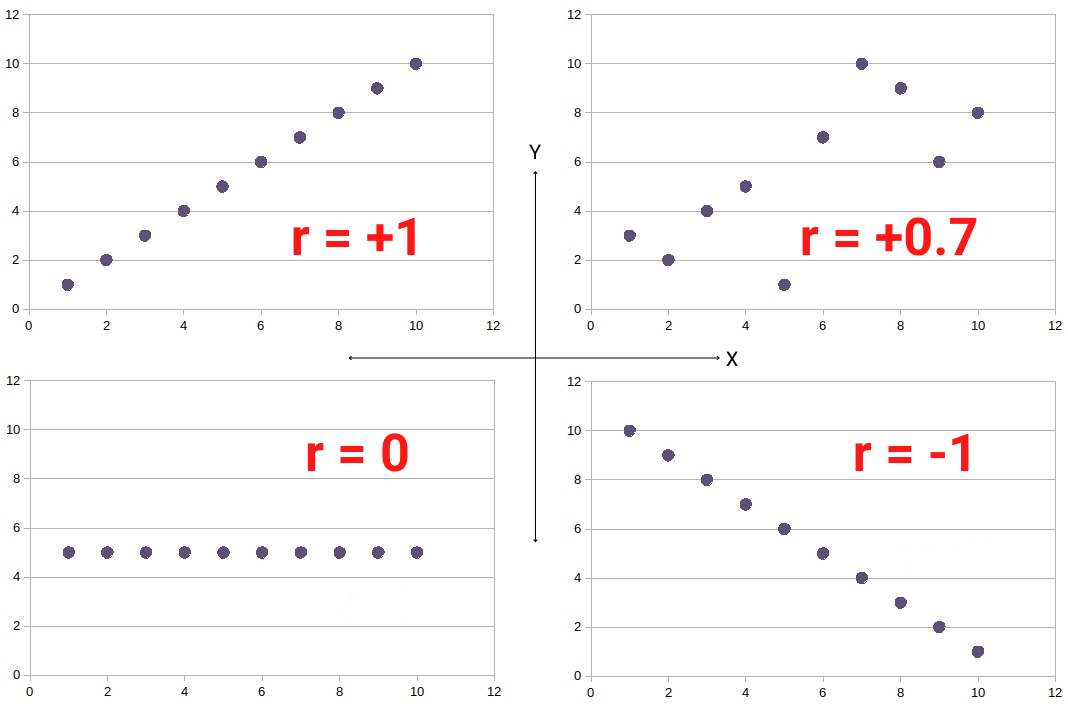
Positive correlation
A positive correlation means that as one co-variable increases, the other co-variable also increases. Or, to put it in mathematical terms, it is when the correlation coefficient is a value greater than 0:
- Perfect positive correlation (+1.0): The co-variables increase in exact mathematical proportion to one another. On a scattergram, every single data point falls directly on a straight line sloping upwards from bottom-left to top-right.
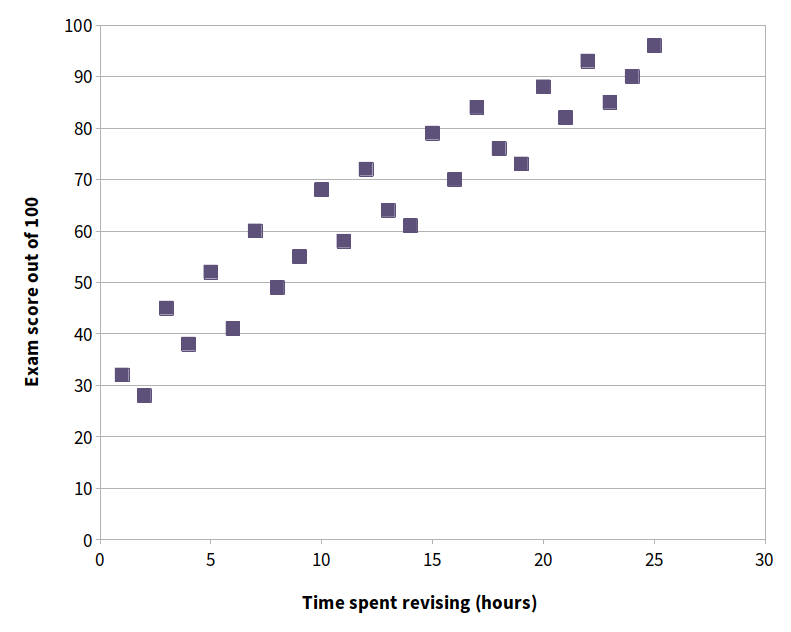
- Strong positive correlation (+0.5 to +0.9): The co-variables show a clear upward relationship, but individual data points vary slightly. On a scattergram, the points cluster closely around an upward-sloping line of best fit.
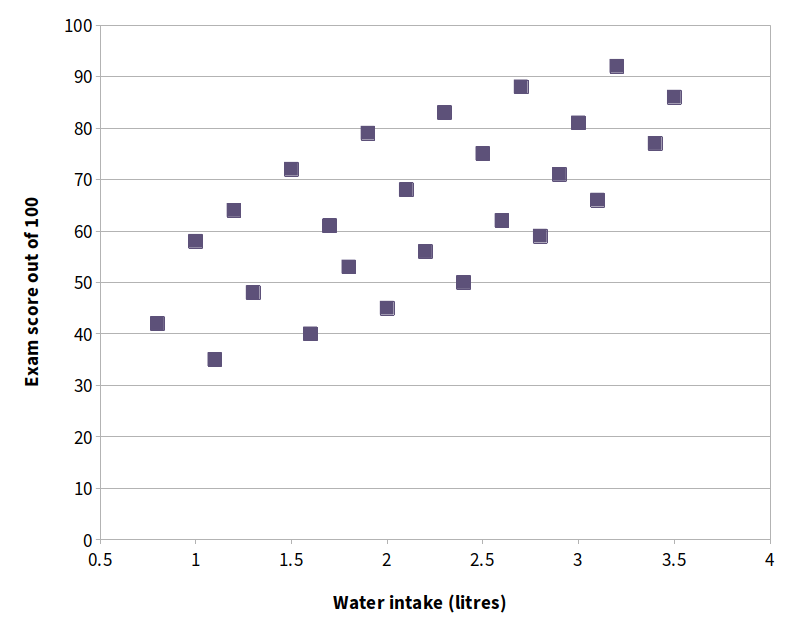
- Weak positive correlation (+0.1 to +0.4): There is a general trend for both co-variables to increase together, but the data points are widely scattered around the line of best fit.
For example, if 25 students took a test and there were a perfect positive correlation (+1.0) between how many hours each one spent revising and their exam score, the scattergram would look like this:
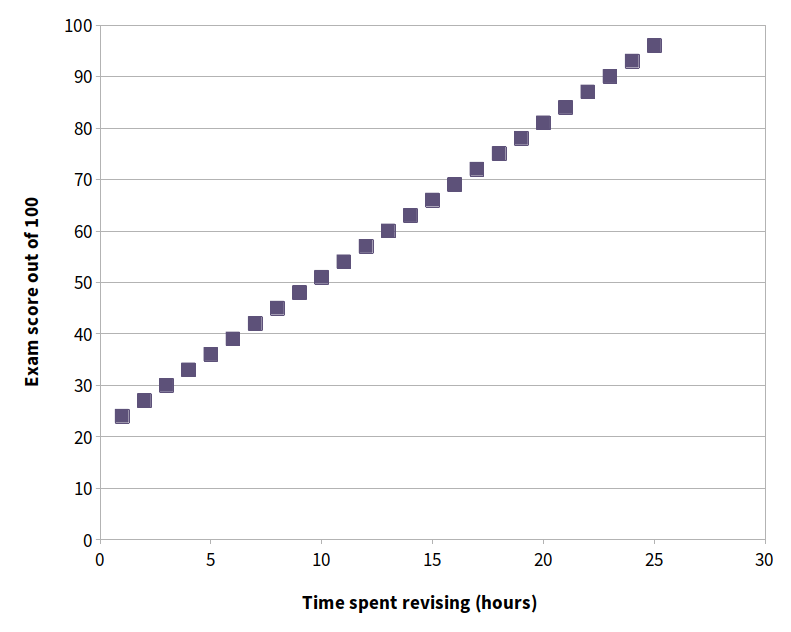
However, a perfect +1.0 correlation like this is highly unlikely in psychological research because human behaviour is influenced by many factors. For example, while revision time helps, an individual’s exam performance is also affected by extraneous variables such as baseline intelligence, stress, sleep quality the night before, and luck.
So, instead of a perfect correlation, you might get a strong positive correlation between time spent revising and exam performance (i.e. a coefficient between +0.5 and +0.9). Plotted on a scattergram, that might look like this:
If we change the co-variable to something less directly related to exam performance – such as daily water intake – we might get a weak positive correlation (i.e. a coefficient between +0.1 and +0.4). Taking extra steps to stay hydrated might help to some degree but its impact on exam mark is probably quite minor compared to revision time or baseline intelligence. So, plotted on a scattergram, the correlation between exam performance and water intake might look like this:
Negative correlation
A negative correlation means that as one co-variable increases, the other co-variable decreases. Mathematically, it is when the correlation coefficient is a value less than 0:
- Perfect negative correlation (-1.0): As one co-variable increases, the other decreases in exact mathematical proportion. On a scattergram, every single data point falls directly on a straight line sloping downwards from top-left to bottom-right.
- Strong negative correlation (-0.5 to -0.9): The co-variables show a clear inverse relationship, but individual data points vary slightly. On a scattergram, the points cluster closely around a downward-sloping line of best fit.
- Weak negative correlation (-0.1 to -0.4): There is a general trend for one co-variable to decrease as the other increases, but the data points are widely scattered around the line of best fit.
For example, if 25 students took a test and there was a perfect negative correlation (-1.0) between the number of hours spent playing video games that week and their exam mark, the scattergram would look like this:
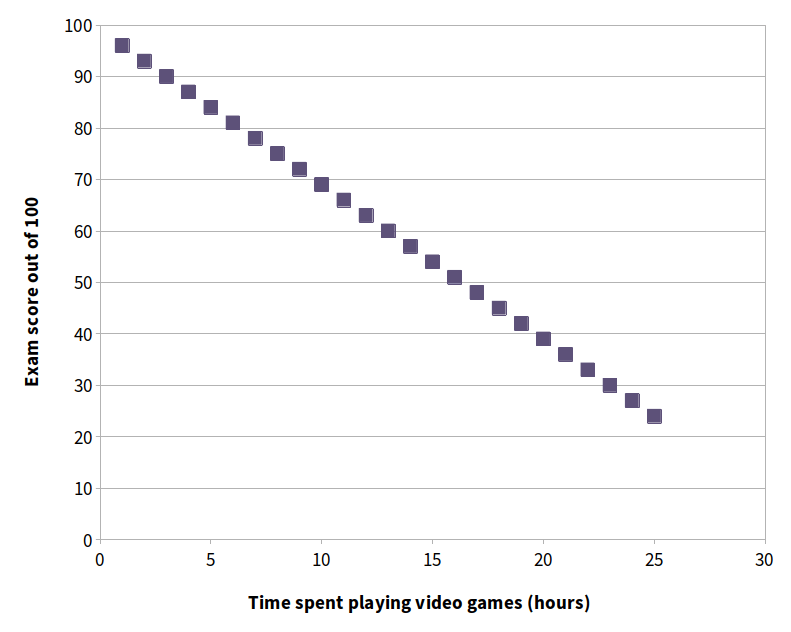
But, like with positive correlations, a perfect -1.0 relationship is highly unrealistic in psychology because human behaviour is complex.
So, instead of a perfect negative correlation, you are more likely to see a strong negative correlation between hours spent gaming the night before and exam performance (i.e. a coefficient between -0.5 and -0.9). Plotted on a scattergram, that might look like this:
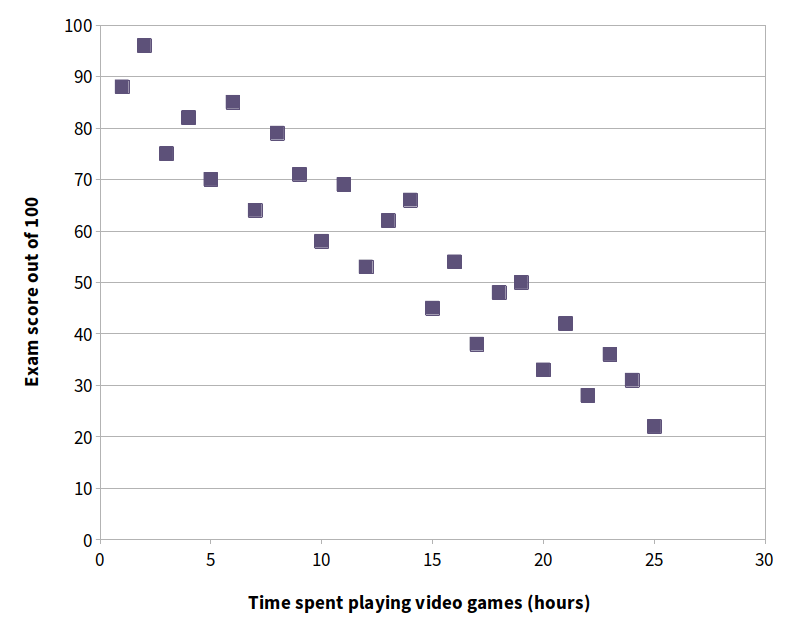
A weak negative correlation (-0.1 to -0.4) means that as one co-variable increases, the second co-variable shows a slight tendency to decrease, but the relationship is weak and inconsistent.
These video game (co-variable 1) and exam performance (co-variable 2) figures are completely made up and so there might instead be a weak negative correlation between the two co-variables. On a scattergram, this would mean the data points are widely scattered rather than forming a tight pattern, like this:
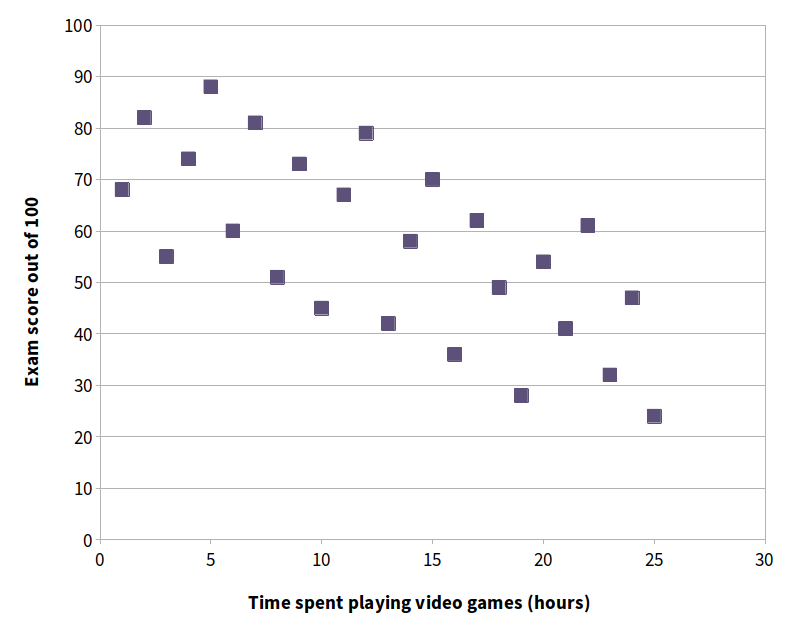
No correlation
No correlation means there is no relationship whatsoever between the two co-variables. As one co-variable changes, the other changes completely independently. Absolutely no correlation would give a correlation coefficient of exactly 0.
For example, if you measured a student’s shoe size and compared it with their exam mark, you would expect a zero correlation coefficient of 0 because the two co-variables are completely irrelevant to each other. Knowing someone’s shoe size should (in theory) give you no information about how well they will perform in an exam.
So, plotted on a scattergram, the data points show no discernable pattern or trend. Instead, they form a random, scattered cloud of dots where it is impossible to draw a meaningful line of best fit:
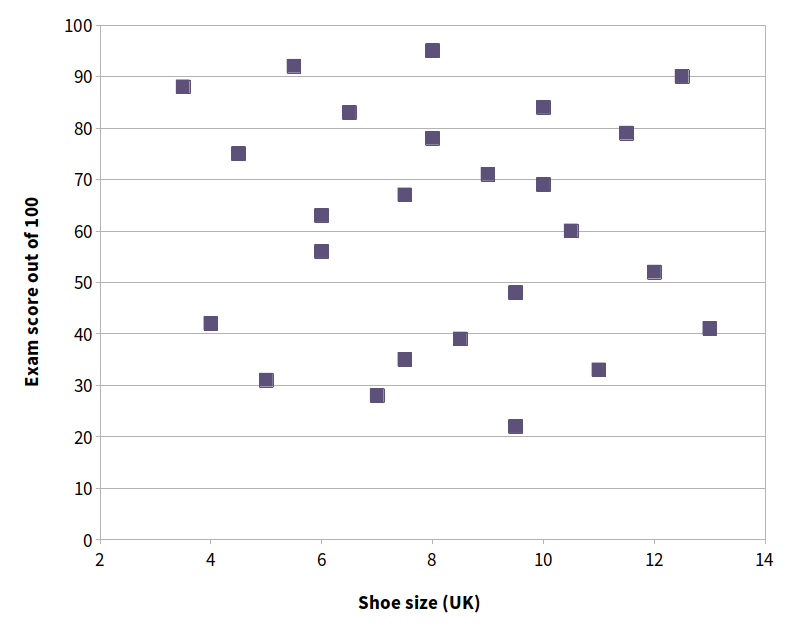
However, even when two variables are completely unrelated – like shoe size and exam performance – getting a correlation coefficient of exactly 0.00 is quite rare (especially for a test involving only 25 participants).
Because of random chance, natural fluctuations in the data will almost always produce a slight tilt in one direction or another. For example, if two or three students with slightly smaller feet happened to perform really well on exam day purely by coincidence, your sample might result in a tiny negative correlation (e.g. -0.07).
For this reason, psychologists rely on rely on inferential statistics to determine whether a correlation reflects a real relationship in the wider population or is just a result of random chance. To do this, researchers check if the calculated correlation coefficient reaches a specific threshold of statistical significance (usually set at a probability level of p < 0.05).
Obtaining data for correlation studies
To conduct a correlational study, researchers must collect paired numerical or ranked data on two co-variables. Unlike experimental research, there is no manipulation of an independent variable and no deliberate control group. Instead, researchers just measure existing traits, scores, or behaviours as they naturally occur and examine whether the two co-variables are related.
Gathering data to conduct a correlational study is similar to an experiment. Psychologists can use the following methods:
- Direct measurements: Collecting physical or objective numerical data (e.g. setting exams and measuring the scores or gathering screen-time logs.
- Self-report methods: E.g. using questionnaires, surveys, and interviews to gather self-reported scores (e.g. asking participants to rate their daily anxiety levels).
- Psychometric tests: Standardised testing tools used to quantify specific traits or abilities (e.g. intelligence tests or stress assessments).
- Secondary data: Utilising pre-existing official records or statistics rather than gathering new data directly (e.g. school attendance records or historical exam results).
When conducting correlational research, researchers must carefully plan how the co-variables are measured, paired, and analysed to ensure the findings are valid and reliable.
- Paired co-variables: A score for both co-variables must be collected from every participant so that each pair of scores can be compared.
- Operationalisation: Researchers must clearly operationalise both co-variables, making it explicit exactly how each variable is measured (e.g. defining ‘revision time’ as ‘total minutes recorded via a study log during a two week period’).
- Statistical calculations: Researchers use an appropriate correlation coefficient to measure the strength and direction of the relationship between the two co-variables. For example, Spearman’s rho is used for ordinal data, whereas Pearson’s r is used for interval or ratio data.
<<< Previous: The self-report method
Next: Case studies >>>
<<< Back to OCR psychology revision notes
<<< Back to AQA psychology revision notes